Why Your Azure Bill Is High Even When Your Resources Are Right-Sized
In this article

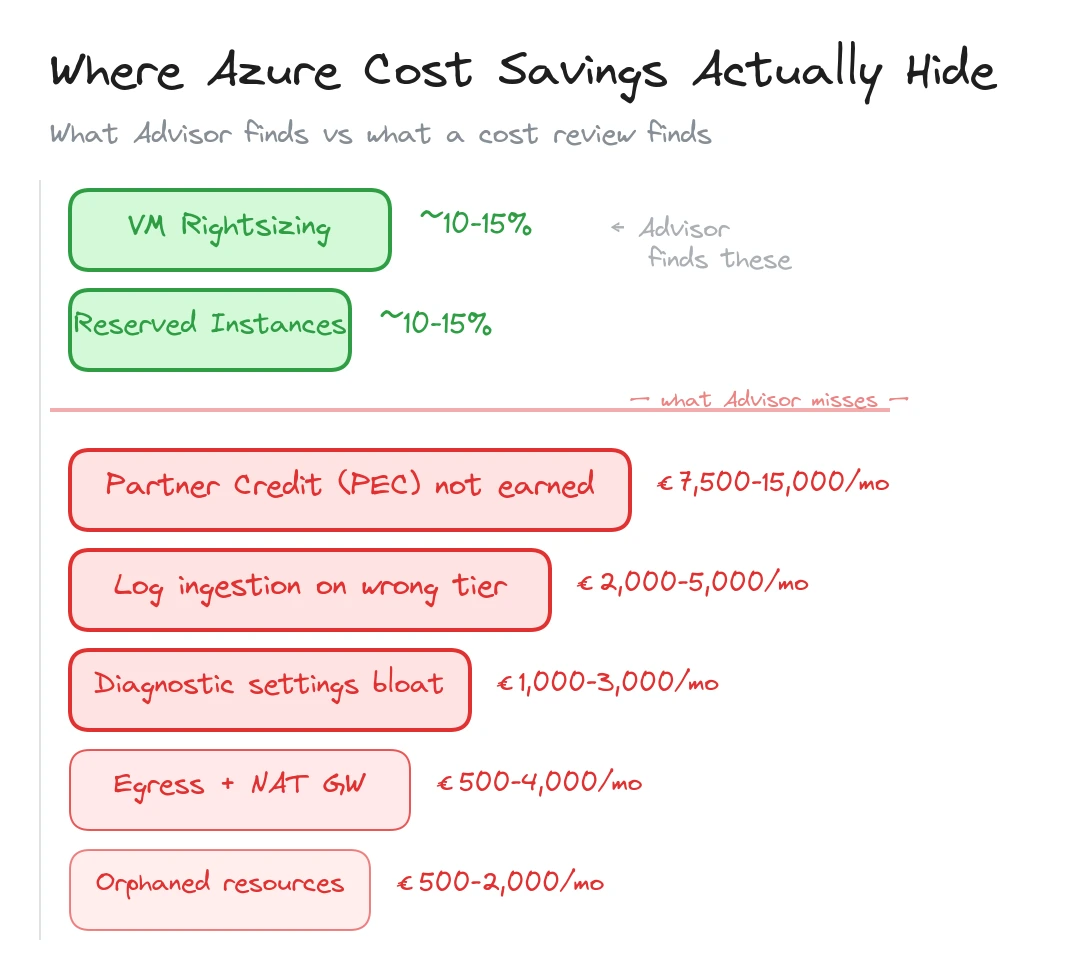
In short: Rightsizing and reserved instances capture maybe 20-30% of available savings. The rest hides in partner configuration (PEC), log ingestion sprawl, unused private endpoints, egress surprises, diagnostic settings nobody audits, and orphaned resources. Most of these are fixable in a 1-2 week cost review.
Most Azure cost optimisation starts and ends with the same two levers: rightsizing VMs and buying reserved instances. Both are valid. Azure Advisor will tell you about them. Your FinOps tool will surface them in the first dashboard. If that is all you do, you will capture maybe 20-30% of the savings available.
The rest hides in places that Advisor doesn’t flag and FinOps dashboards don’t surface. These are configuration-level problems, architectural side effects, and operational oversights that accumulate quietly over months. They don’t show up as a single large line item. They spread across dozens of small charges that look normal individually but add up to thousands of euros per month.
Here is where we consistently find money leaking in enterprise Azure environments.
| Cost leak | Typical monthly impact | How to find it |
|---|---|---|
| Missing PEC (partner credit) | €7,500-€15,000+ | Check CSP agreement + RBAC assignments |
| Log ingestion on wrong tier | €2,000-€5,000 | Compare Basic vs Analytics table usage |
| Unused private endpoints | €350-€1,000 | Azure Resource Graph query |
| Egress and NAT Gateway | €500-€4,000+ | Network Watcher flow analytics |
| Diagnostic settings explosion | €1,000-€3,000 | Audit diagnostic settings per resource type |
| Orphaned disks and NICs | €500-€2,000 | Resource Graph query for unattached resources |
Your Partner Isn’t Earning Credit on Your Behalf
If your Azure runs through a CSP partner, Microsoft offers Partner Earned Credit (PEC) when the partner has active operational access to your environment. The reduction on eligible consumption is often around 15%, and depending on your commercial agreement, that benefit can flow back to you as reduced Azure pricing or funded services.
We covered this in detail in our article on partner cost savings. The short version: most enterprises on CSP agreements don’t receive PEC benefit because the partner lacks the required RBAC access, the billing model is misconfigured, or nobody set it up in the first place.
For an enterprise spending EUR 150,000/month on Azure, with roughly EUR 80,000 eligible for PEC after subtracting reservations and savings plans, the gap is around EUR 12,000/month. That is EUR 144,000/year in benefit that evaporates because of a configuration problem.
Check your partner’s RBAC assignments. Ask whether PEC is being earned. If they don’t know what PEC is, that tells you something important about the relationship.
Log Ingestion Is Your Invisible Cost Centre
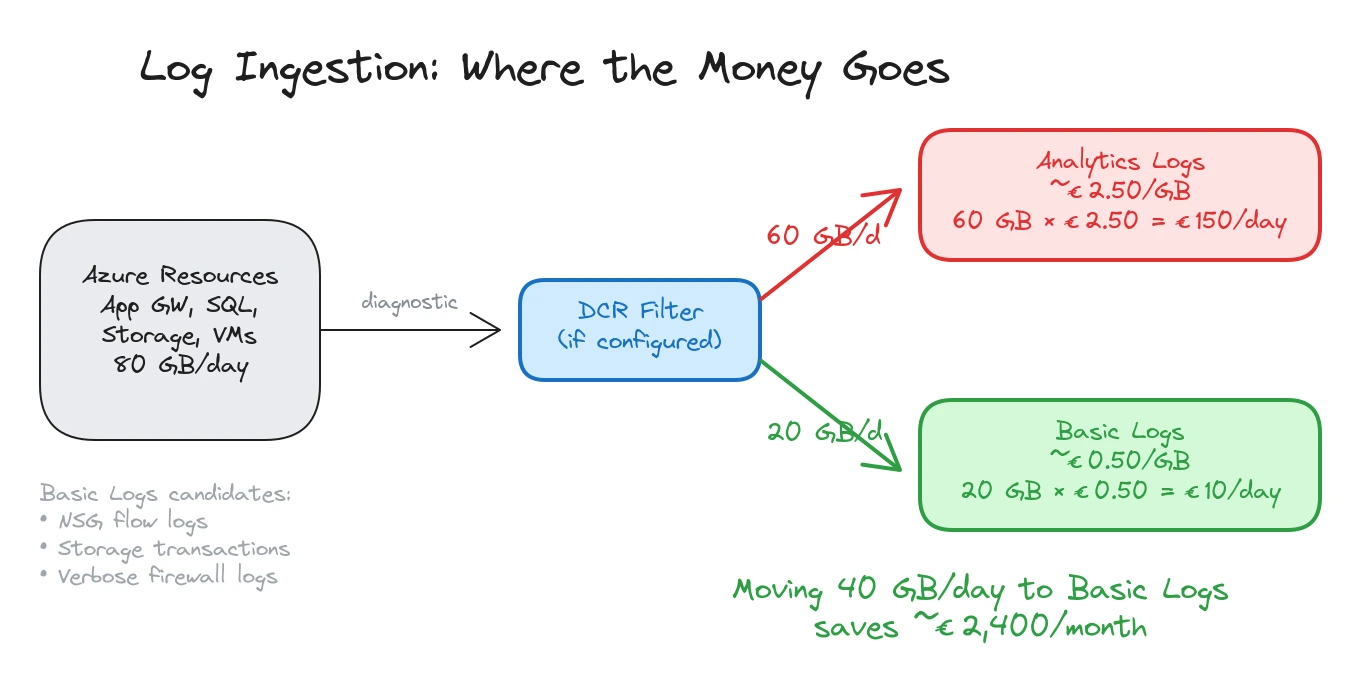
Log Analytics and Microsoft Sentinel bill on data volume. At pay-as-you-go rates in West Europe, Analytics Logs cost roughly EUR 2.50/GB. A mid-size Azure environment ingesting 80 GB/day spends about EUR 6,000/month on log storage alone.
The problem isn’t that logging is expensive. It’s that most environments ingest everything at the highest tier without any filtering strategy. We wrote about this pattern in our Sentinel ingestion cost control article, and we see it in nearly every estate we review.
Three things drive unnecessary log spend.
Diagnostic settings that ship everything. When someone enables diagnostic settings on a resource, the default in many IaC templates is “send all categories to Log Analytics.” For a busy Application Gateway, that means access logs, performance logs, and firewall logs, all landing in the Analytics tier at full volume. For a storage account, it means every read, write, and delete operation. A single storage account with heavy blob access can generate 5-10 GB/day of transaction logs that nobody queries.
No use of Basic Logs. Microsoft offers a Basic Logs tier at roughly EUR 0.50/GB for data that you need for investigations but don’t run scheduled queries against. NSG flow logs, verbose firewall logs, container stdout, and storage access logs are all good candidates. Moving 40 GB/day from Analytics to Basic saves about EUR 80/day, or roughly EUR 2,400/month.
No Data Collection Rules filtering. DCRs let you filter and transform data before it reaches the workspace. A Windows Security Event stream that ingests every event ID generates 10-20 GB/day per hundred servers. Filtering to only the event IDs your detection rules reference cuts that by 60-80%. If your workspace was set up before DCRs existed and nobody revisited the configuration, you are paying for data you never use.
Unused Private Endpoints Add Up Quietly
A single private endpoint costs about EUR 7/month. That sounds negligible. In an enterprise estate with 300+ private endpoints, the base cost is over EUR 2,100/month before counting the data processing charges.
The hidden cost isn’t the endpoints you use. It’s the ones you don’t. We regularly find private endpoints for resources that were decommissioned, endpoints created in multiple VNets for the same resource when only one VNet actually needs access, and endpoints provisioned “just in case” during initial deployments that were never connected to application workloads.
A quick Azure Resource Graph query surfaces orphaned private endpoints:
resources
| where type == "microsoft.network/privateendpoints"
| extend connectionState = properties.privateLinkServiceConnections[0].properties.privateLinkServiceConnectionState.status
| where connectionState != "Approved" or isnull(connectionState)
For endpoints that are approved but potentially unused, cross-reference with network flow data or DNS query logs. An endpoint that has been provisioned for six months with zero DNS queries is a candidate for removal.
Beyond the endpoint itself, each private endpoint creates a network interface with a private IP allocation, and needs at least one DNS record in a private DNS zone. On large environments, the cost multiplication is real: 300 private endpoints means 300 NICs consuming IP address space and 300+ DNS records across multiple zones. The NIC and DNS overhead is free in isolation, but the operational cost of managing stale records, the IP address space pressure in busy subnets, and the troubleshooting complexity when DNS records point to decommissioned endpoints all carry a price that shows up in engineering hours rather than the Azure bill.
At EUR 7/month each, cleaning up 50 orphaned endpoints saves EUR 350/month. Not dramatic on its own, but these small leaks compound across a full environment.
Pattern: The first three cost leaks (PEC, log ingestion, private endpoints) are configuration problems, not architecture problems. They can be fixed without changing workloads, redeploying resources, or touching application code.
Egress Costs That Nobody Budgeted For
Azure ingress is free. Egress is not, and the pricing varies significantly depending on where the traffic goes.
Internet egress from a standard Azure region costs around EUR 0.08/GB for the first 10 TB/month. Cross-region traffic within Azure costs about EUR 0.02/GB. VNet peering traffic within the same region is EUR 0.01/GB in each direction.
These rates seem small until you look at actual volumes. An Application Gateway serving a public API can easily push 500 GB/month of internet egress, about EUR 40/month. A busy Azure Front Door profile serving static content adds more. Cross-region replication for storage accounts or databases generates ongoing transfer charges.
The surprises come from unintentional cross-region traffic. A workload in West Europe calls an API hosted in North Europe because nobody checked which region the dependency lives in. A Log Analytics workspace in one region receives diagnostic data from resources in three other regions, incurring cross-region ingress charges on every GB.
Application Gateway and Front Door also have their own data processing charges on top of the underlying egress. App Gateway v2 charges about EUR 0.007/GB for data processing. Front Door charges vary by tier but add per-request and per-GB fees.
NAT Gateway is another egress cost driver that flies under the radar. When all outbound traffic from a subnet routes through a NAT Gateway, every byte of internet-bound traffic incurs egress charges plus NAT Gateway data processing fees (around EUR 0.04/GB). For workloads that make heavy external API calls, pull container images frequently, or transfer data to third-party SaaS platforms, the combined cost adds up fast. A subnet pushing 2 TB/month of outbound traffic through NAT Gateway pays roughly EUR 240/month in processing fees alone, on top of the standard internet egress. Most teams budget for the NAT Gateway hourly cost (about EUR 32/month per gateway) but overlook the per-GB processing charge entirely.
Map your traffic flows. Identify cross-region paths that exist by accident rather than design. Colocate workloads with their dependencies. These changes don’t require new services or tools, just awareness of where traffic actually goes.
Diagnostic Settings That Nobody Audits
Every Azure resource can send diagnostic data to Log Analytics, a storage account, Event Hubs, or a partner solution. Landing zone policies typically deploy diagnostic settings automatically using DeployIfNotExists effects.
The intent is good. The result, after two years, is often an explosion of diagnostic settings that nobody has reviewed. We commonly find resources sending the same logs to two different Log Analytics workspaces (one from a landing zone policy, one added manually during troubleshooting). Resources shipping all diagnostic categories when only two are needed. And storage account diagnostic settings generating massive volumes of transaction logs for accounts that serve as archive tiers with minimal access.
A single Azure SQL Database with all diagnostic categories enabled can send 2-5 GB/day to Log Analytics. Multiply by 40 databases across the estate and you have 80-200 GB/day of SQL diagnostics, most of which nobody queries.
The audit is straightforward: list all diagnostic settings across the estate using Azure Resource Graph, identify which categories are enabled per resource type, and compare against what your monitoring and security teams actually use. Strip out the categories that don’t feed dashboards, alerts, or detection rules.
resources
| where type contains "microsoft.insights/diagnosticsettings"
| extend resourceId = tostring(properties.storageAccountId)
| summarize count() by type, tostring(properties.logs)
This exercise alone often saves 20-30% of Log Analytics spend.
Orphaned Resources
The classic waste category, but it persists because nobody owns the cleanup.
Managed disks detached from VMs accumulate when VMs are deleted but their disks are set to persist. A Premium SSD P30 (1 TB) costs about EUR 100/month whether it’s attached or not. We routinely find 20-50 orphaned disks in mid-size environments, representing EUR 500-2,000/month of waste.
Public IP addresses that aren’t associated with any resource cost about EUR 3.50/month each (Basic SKU) or EUR 4.40/month (Standard). Network interfaces detached from VMs cost nothing on their own but indicate incomplete cleanup. Network Security Groups not associated with any subnet or NIC are free but add operational confusion.
The bigger cost items among orphaned resources are often less obvious: Azure Bastion hosts (EUR 140/month) provisioned for a migration that finished months ago, VPN Gateways (EUR 130+/month) for connections that were replaced by ExpressRoute, and App Service Plans with no apps deployed (billed for the plan, not the apps).
A Practical Cost Audit in Five Steps
If your Azure bill feels higher than it should be and the usual rightsizing advice hasn’t closed the gap, work through these steps.
-
Check your CSP partner configuration. Verify PEC eligibility, confirm RBAC access, and ask how PEC value is reflected in your commercial terms. The fix is a conversation, not a technical exercise.
-
Audit Log Analytics ingestion. Run the
Usagetable query to see GB/day per data type. Identify the top five tables by volume. For each one, confirm that a detection rule, dashboard, or operational process depends on it. Move high-volume, low-signal tables to Basic Logs. -
List all private endpoints and cross-reference with DNS queries and network flows. Remove endpoints for decommissioned resources and consolidate duplicate endpoints.
-
Map egress paths. Use Network Watcher flow logs or Cost Management to identify cross-region and internet egress. Look for accidental cross-region traffic between workloads and their dependencies.
-
Export all diagnostic settings via Resource Graph. Compare enabled categories against actual usage. Disable categories that don’t feed monitoring, security, or compliance requirements.
Each step targets a cost area that standard FinOps tooling misses. Run through them quarterly. Azure environments are not static, and the cost leaks that don’t exist today will appear six months from now as workloads change and new resources are provisioned.
Typical engagement: An Azure cost and platform review goes beyond VM rightsizing. We analyze partner configuration, log ingestion patterns, private endpoint sprawl, egress flows, diagnostic settings, and orphaned resources. The output is a prioritized savings map with EUR estimates and implementation steps. Most reviews take 1-2 weeks.
Related: Your Azure Bill Is Higher Because Your Partner Isn’t Managing Anything PEC and partner accountability · Microsoft Sentinel in 2026 and How to Control Ingestion Costs log ingestion optimisation · What an Azure Landing Zone Audit Actually Finds governance gaps that drive cost
Looking for Azure architecture guidance?
We design and build Azure foundations that scale - landing zones, networking, identity, and governance tailored to your organisation.