Serverless Observability for $0: CloudWatch Logs to Grafana via k3s CronJobs
In this article
- The Pattern: Structured Logs + CronJob + Loki
- Step 1: Structured Logging in Lambda
- Step 2: The CronJob
- Step 3: Loki Labels and Querying
- Step 4: The Grafana Dashboard
- Cost Analysis
- Why Not CloudWatch Dashboards?
- Why Not Prometheus CloudWatch Exporter?
- The Reusable Pattern
- When This Pattern Breaks Down
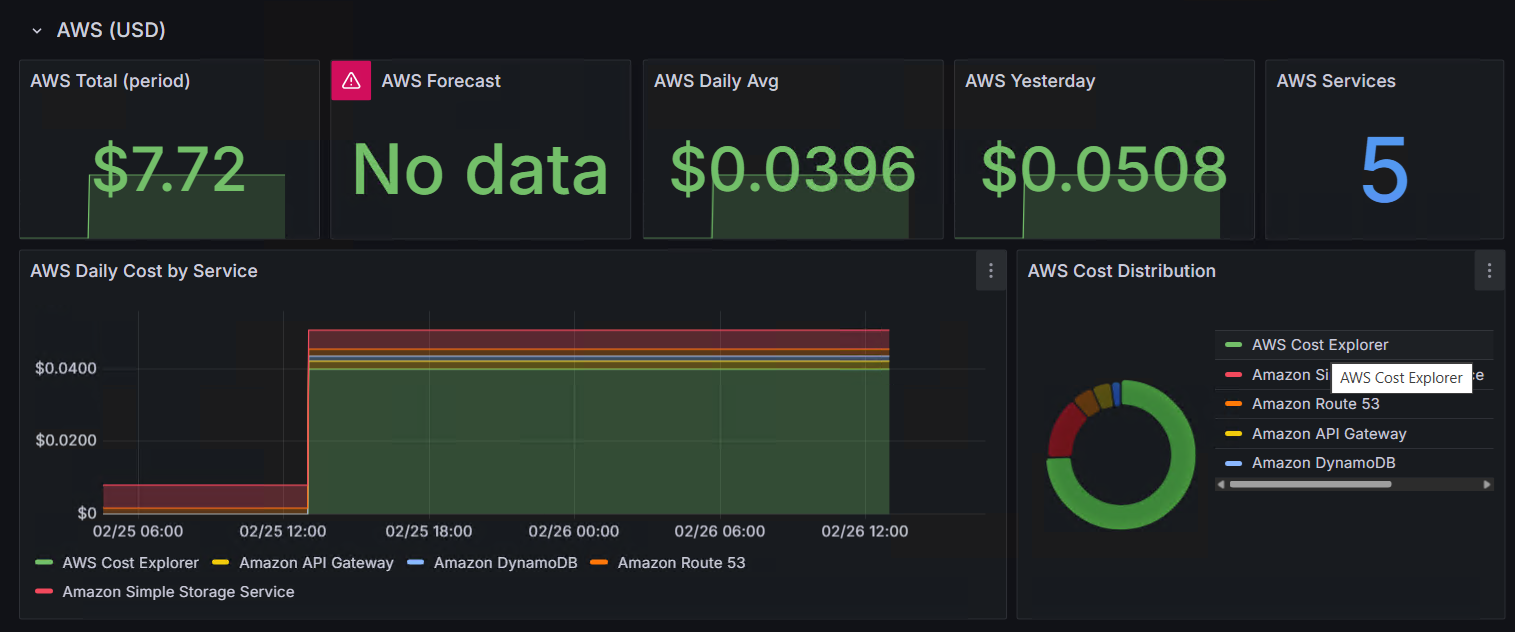
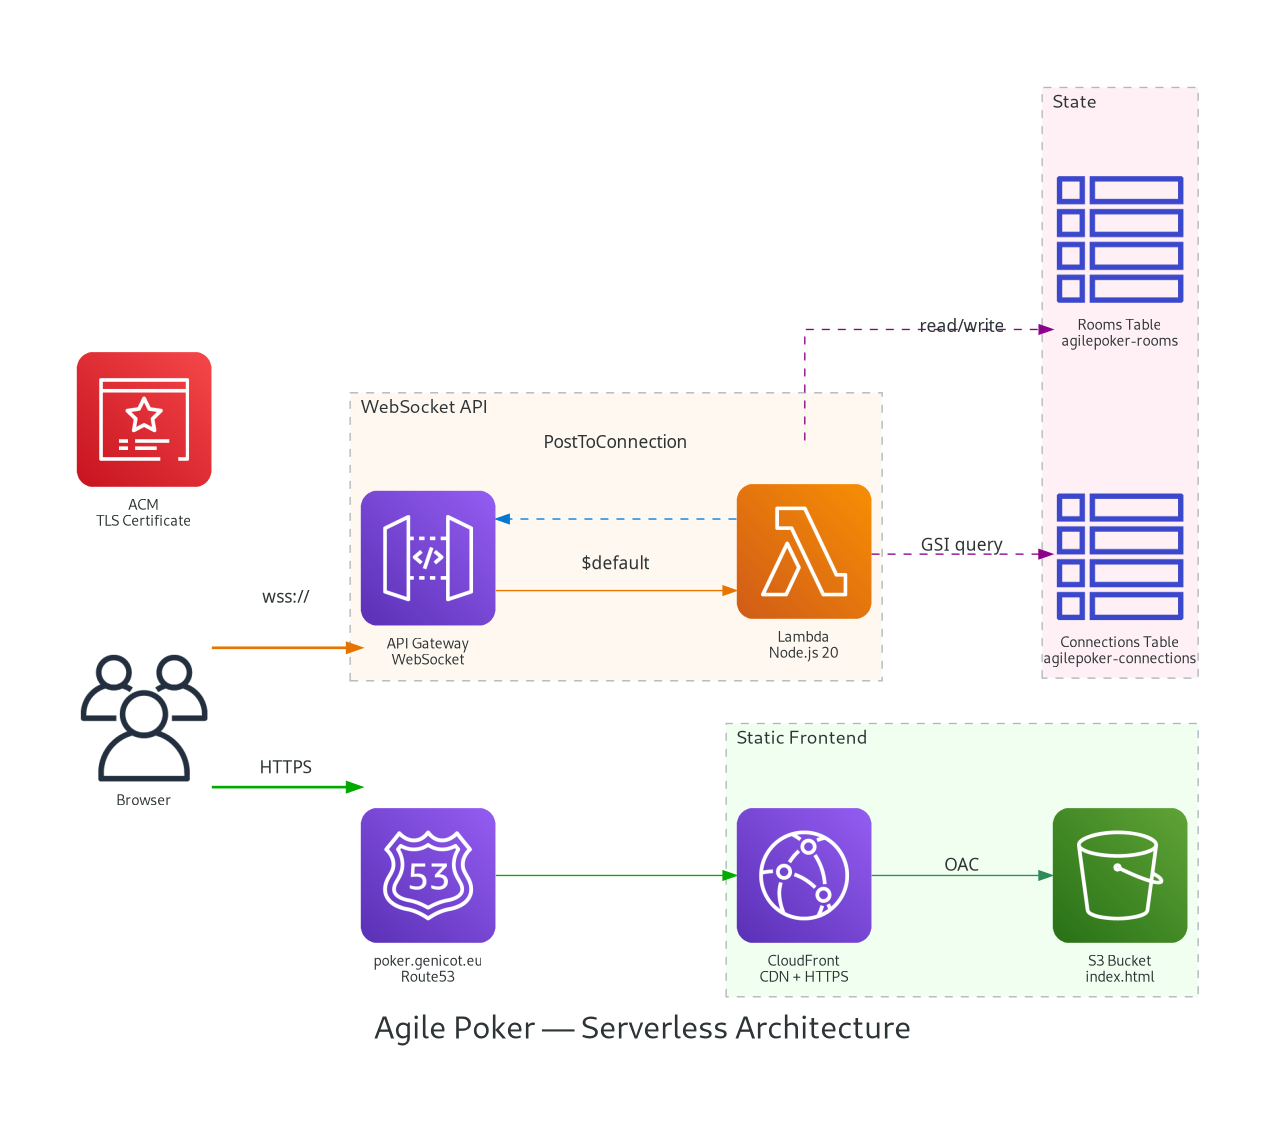
I had a serverless planning poker app running on AWS - Lambda, API Gateway WebSocket, DynamoDB - costing $0.50/month. It worked perfectly, but I was flying blind. No idea how many rooms were created, how many votes were cast, which card scales people preferred. No dashboards, no metrics, no observability.
The constraint: I already have Prometheus, Loki, and Grafana running on a k3s cluster. I did not want to add CloudWatch dashboards (paid), set up a separate Grafana Cloud instance (paid), or deploy any new AWS infrastructure. I wanted the metrics in my existing stack, at zero additional cost.
The Pattern: Structured Logs + CronJob + Loki
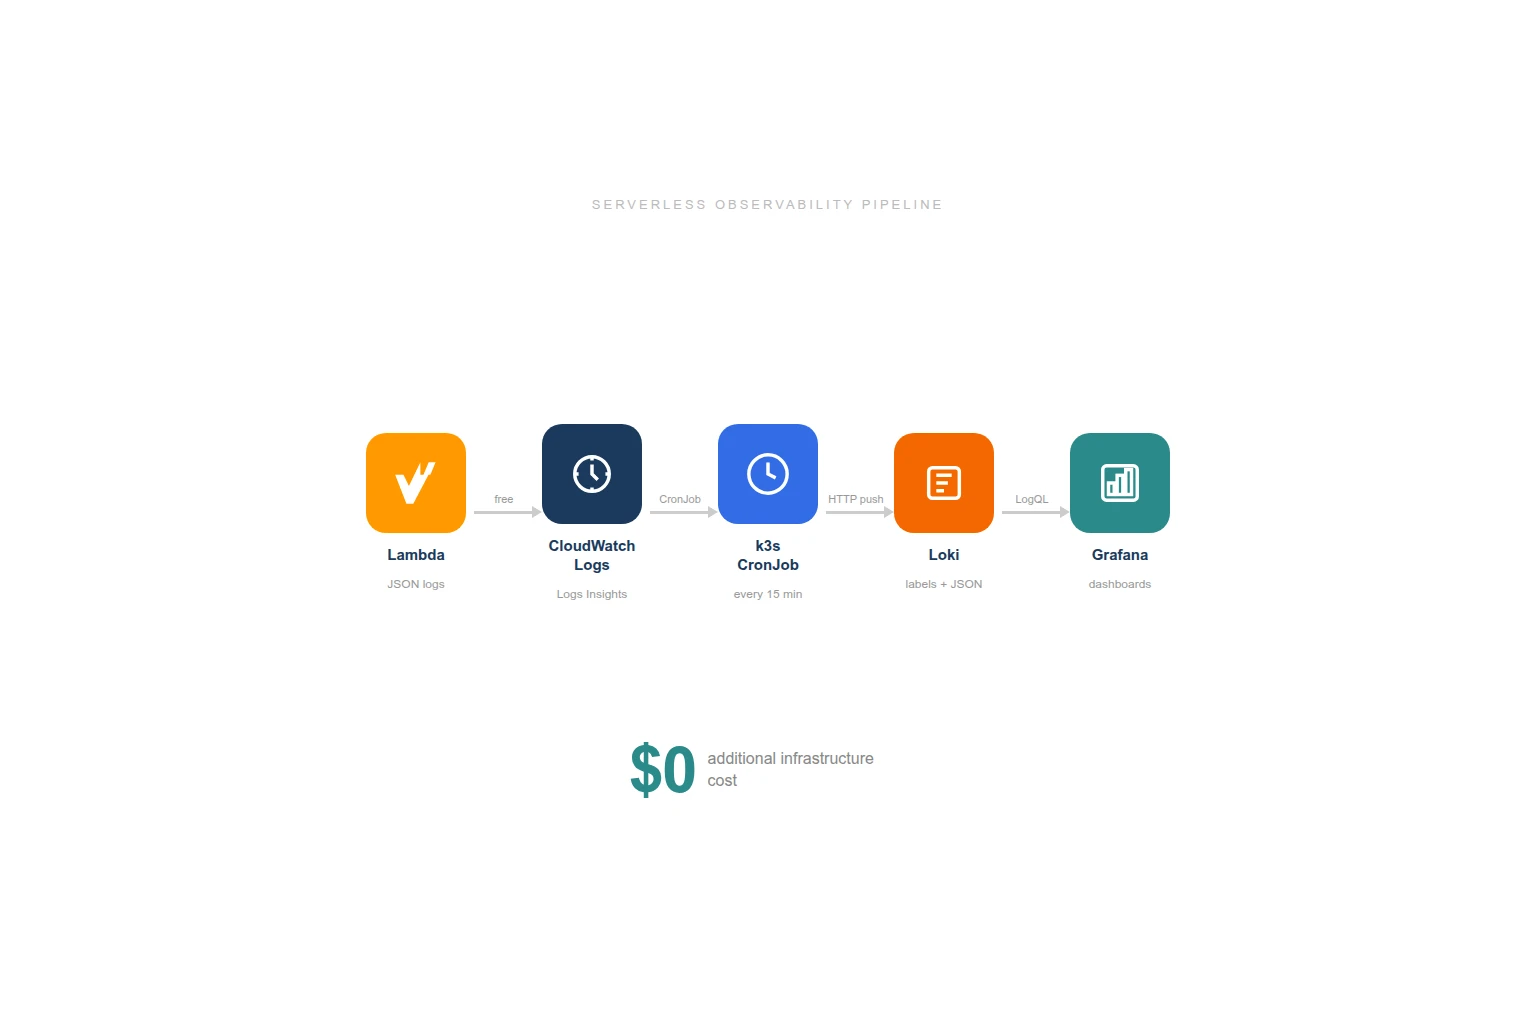
The approach is surprisingly simple:
- Lambda writes structured JSON logs to CloudWatch (which it already does for free)
- A k3s CronJob queries CloudWatch Logs Insights every 15 minutes
- Parsed events get pushed to Loki with appropriate labels
- Grafana dashboards query Loki for totals, trends, and distributions
No new AWS resources. No new services. No new costs. The CronJob pattern already existed in my cluster for AWS cost tracking and CloudFront log ingestion - I just added another one.
Step 1: Structured Logging in Lambda
Every business event gets a one-line console.log with a JSON payload:
// After room creation
console.log(JSON.stringify({
  m: 'agilepoker',
  event: 'create-room',
  roomCode: 'happy-tiger',
  cardScale: 'fibonacci'
}));

// After a vote
console.log(JSON.stringify({
  m: 'agilepoker',
  event: 'submit-vote',
  roomCode: 'happy-tiger',
  vote: '8'
}));
The m: 'agilepoker' field is a marker - it lets me filter for my events reliably in CloudWatch Logs without matching random Lambda runtime messages.
Six events are logged:
| Event | When | Fields |
|---|---|---|
create-room | Room created | roomCode, cardScale |
join-room | Participant joins | roomCode, isSpectator |
submit-vote | Vote submitted | roomCode, vote |
reveal-votes | Votes revealed | roomCode |
reset-votes | New round started | roomCode |
disconnect | Participant leaves | roomCode, remaining count |
These logs cost nothing extra. Lambda already writes to CloudWatch Logs as part of AWSLambdaBasicExecutionRole. The structured JSON adds a few bytes per invocation - negligible.
Step 2: The CronJob
I already had two CronJobs in my monitoring namespace:
aws-costs-to-loki- daily Cost Explorer query pushed to Lokicloudfront-to-loki- CloudFront access logs from S3 pushed to Loki every 10 minutes
The new agilepoker-to-loki CronJob follows the exact same pattern: python:3.12-slim image, inline script, pip install boto3 at runtime, push to Loki’s HTTP API.
# CloudWatch Logs Insights query
query = """
fields @timestamp, @message
| filter @message like /"m":"agilepoker"/
| sort @timestamp asc
| limit 1000
"""

response = logs.start_query(
    logGroupName="/aws/lambda/agilepoker-websocket",
    startTime=start_time,  # 20 minutes ago (overlap for safety)
    endTime=end_time,
    queryString=query,
)
The script:
- Runs a Logs Insights query over the last 20 minutes (5-minute overlap with the 15-minute schedule to avoid gaps)
- Extracts the JSON from each log line (Lambda formats them as
timestamp requestId INFO {json}) - Groups events by type
- Pushes to Loki with labels
job=agilepokerandevent=<type>
Each event becomes a Loki log entry with the original CloudWatch timestamp, so Grafana shows the actual event times, not the CronJob execution time.
Step 3: Loki Labels and Querying
The push format follows Loki’s HTTP API:
{
  "streams": [
    {
      "stream": { "job": "agilepoker", "event": "create-room" },
      "values": [
        ["1740498804319000000", "{\"event\":\"create-room\",\"roomCode\":\"happy-tiger\",\"cardScale\":\"fibonacci\"}"]
      ]
    },
    {
      "stream": { "job": "agilepoker", "event": "submit-vote" },
      "values": [
        ["1740498810000000000", "{\"event\":\"submit-vote\",\"roomCode\":\"happy-tiger\",\"vote\":\"8\"}"]
      ]
    }
  ]
}
The event label is indexed by Loki, so filtering by event type is fast. The JSON payload inside each log line is parsed at query time with | json - no indexing overhead for business fields like roomCode or cardScale.
Step 4: The Grafana Dashboard

With structured events in Loki, the dashboard queries are straightforward LogQL:
Stat panels (totals):
count_over_time({job="agilepoker", event="create-room"} [$__range])
count_over_time({job="agilepoker", event="submit-vote"} [$__range])
Time series (activity over time):
sum by (event)(count_over_time({job="agilepoker"} [1h]))Pie chart (scale popularity):
sum by (cardScale)(count_over_time({job="agilepoker", event="create-room"} | json [$__range]))Vote distribution:
sum by (vote)(count_over_time({job="agilepoker", event="submit-vote"} | json [$__range]))The dashboard has four sections: activity stats (rooms, votes, joins, reveals), trends over time, breakdowns (scale popularity, vote distribution, spectator ratio), and raw event logs for debugging.
Cost Analysis
| Component | Cost |
|---|---|
| Lambda structured logging | $0 (CloudWatch Logs already included) |
| CloudWatch Logs storage | $0 (kilobytes per month, well within free tier) |
| CloudWatch Logs Insights queries | $0.005/GB scanned - my logs are kilobytes |
| CronJob on k3s | $0 (50m CPU, 64Mi RAM, runs 5 seconds every 15 min) |
| Loki storage | $0 (already running, marginal additional entries) |
| Grafana dashboard | $0 (already running) |
| Total | $0 |
The CronJob reuses existing AWS credentials (same IAM user as the CloudFront log ingestion) and pushes to the same Loki instance. No new secrets, no new services, no new bills.
Why Not CloudWatch Dashboards?
CloudWatch dashboards cost $3/month each. CloudWatch custom metrics cost $0.30/metric/month. For my planning poker tool that costs $0.50/month to run, spending $3+ on monitoring would be absurd.
More importantly, I already have Grafana. Adding another dashboard tool creates fragmentation - now you have to check two places. The CronJob approach keeps everything in one pane of glass.
Why Not Prometheus CloudWatch Exporter?
The CloudWatch Exporter (or YACE) scrapes CloudWatch Metrics into Prometheus. It gives you Lambda invocations, durations, errors, API Gateway connection counts, DynamoDB consumed capacity - infrastructure metrics.
I could add it later for that layer, but it would not give me business metrics. “Lambda was invoked 47 times” tells you nothing about how many rooms were created or which card scale is most popular. Structured logging captures the business events that actually matter.
The Reusable Pattern
This approach works for any serverless application:
- Add structured JSON logging to your Lambda functions (one line per business event)
- Deploy a CronJob that queries CloudWatch Logs Insights
- Push to Loki (or any log aggregation system with an HTTP API)
- Build dashboards on top
The CronJob is a ~60 line Python script. The structured logging is a console.log per event. The Grafana dashboard is a JSON file. Total implementation time was under an hour.
The same pattern powers my cost tracking (AWS Cost Explorer to Loki), CDN monitoring (CloudFront logs to Loki), and now application metrics. Three CronJobs, one Loki instance, one Grafana. No agents, no sidecars, no additional SaaS subscriptions.
When This Pattern Breaks Down
- Real-time alerting: 15-minute lag is fine for dashboards but not for paging. If you need alerts on Lambda errors within seconds, use CloudWatch Alarms directly.
- High-volume logs: Logs Insights scans per GB. If your Lambda produces gigabytes of logs per day, the scan cost adds up. At that point, consider streaming with CloudWatch Logs subscriptions.
- Cross-account: If your Lambda runs in a different AWS account than your CronJob credentials, you need cross-account IAM roles.
For small-scale serverless applications - internal tools, side projects, portfolio pieces - this pattern is effectively free and takes minutes to set up.
More from the blog
When Your FinOps Tool Becomes Your Biggest Cost: The AWS Cost Explorer Trap
From Kubernetes to $0.50/month: Migrating a Real-Time App to AWS Serverless