
Your Azure Budget Can Change Overnight. Your 2027 Planning Shouldn't.
In this article
- January 2027: another variable in your cloud budget
- 1 February 2027: a regional increase that does come with numbers
- The problem with the usual Azure budget estimate
- Price and consumption compound
- Azure prices do not all follow the same commercial mechanism
- From cost reporting to financial planning
- The Governator annual Budget Planner
- What happens with the 2027 price announcements?
- A budget should explain itself
- Don’t wait until January to revisit your 2027 budget
- Official Microsoft references
Microsoft’s pricing changes for early 2027 show a basic problem with the way most organisations estimate Azure costs: a budget built on yesterday’s prices is not a reliable forecast of tomorrow’s spend.
January 2027: another variable in your cloud budget
Picture the usual October. You spend several weeks on the 2027 Azure budget. You collect the latest invoices, calculate the annual run rate, add the new projects and present the numbers to management. Everything looks reasonable.
Then Microsoft publishes new pricing guidance, your exchange rate assumption shifts, or a reservation approaches its expiry date, and the annual estimate needs another round of calculations.
This year that scenario is on the calendar. On 8 July 2026 Microsoft announced that it would “transition to annual local currency pricing updates every January for its Commercial Cloud services”. The next update takes effect on 1 January 2027, and detailed guidance follows in November 2026. Product specific price adjustments are still communicated separately.
To be clear: Microsoft has not announced a single percentage increase for all Azure services in January 2027. What changes, and by how much, depends on the products, the purchasing arrangement, the contract and the currencies involved.
That still leaves organisations preparing 2027 budgets in October with an awkward question. How do you approve next year’s cloud spend when part of next year’s pricing is not known yet?
1 February 2027: a regional increase that does come with numbers
January is not the only date. Azure Service Health is now sending affected customers an action required notice, “Prepare for specific Azure VM series and Azure Storage service price updates in seven Azure regions globally”. From 1 February 2027, prices for specific Virtual Machine series and Storage services increase in seven regions:
| Region | Increase |
|---|---|
| EU West (Amsterdam) | 9% |
| EU North (Dublin) | 17% |
| France Central | 11% |
| France South | 11% |
| Norway East | 9% |
| Norway West | 9% |
| Southeast Asia (Singapore) | 8% |
The notice also lists what is excluded. On the compute side that includes the v1 series, the v2 series such as Av2, Dv2, Dsv2 and Fsv2, and the new v7 series. On the storage side it excludes, among others, General Block Blob, Standard Page Blob, Tables, Queues, Storage Bandwidth and the Transaction Optimized SKU.
This one has a date and a percentage, and it is still not a percentage you can put on the whole invoice. It applies to the affected series and services, in those regions, and to pay as you go usage: a reservation keeps the price it was bought at for its term. For a company running in West Europe, the number to work out before February is the share of its Virtual Machines and Storage cost that is actually in scope. That share, multiplied by 9%, is the budget effect, from February only.
The problem with the usual Azure budget estimate
Most annual Azure budgets start from the same calculation: take the current monthly spend, multiply it by twelve, add expected growth and perhaps a safety margin.
Several things can move the 2027 invoice independently of each other:
- Consumption grows or shrinks regardless of unit prices
- Microsoft adjusts the price of individual services
- Currency movements change the invoiced amount, where the contract converts
- Reserved instances and savings plans expire or renew
- Projects start in different months of the year
- Existing resources are resized or decommissioned
- Storage grows on a different curve from compute
- Negotiated commercial conditions change
These are not interchangeable. A 5% increase caused by more consumption is a different thing from a 5% increase caused by higher unit prices. The first can be explained by business growth. The second may need more budget without buying any additional capacity. In most spreadsheets both end up as the same unexplained percentage.
Price and consumption compound
A simple example. An organisation spends €100,000 a month on Azure, so its annual baseline is €1.2 million. For planning, it models 7% consumption growth and a hypothetical 5% unit price increase, both over the full year.
| Budget component | Annual impact |
|---|---|
| Existing expenditure | €1,200,000 |
| Consumption growth (7%) | +€84,000 |
| Unit price adjustment (5%) | +€60,000 |
| Price and volume interaction | +€4,200 |
| Projected annual expenditure | €1,348,200 |
The 5% is an illustrative scenario assumption. Microsoft has announced no such increase.
Even this example shows why adding percentages to last year’s total is not enough. The two effects multiply, and the €4,200 belongs to neither of them. A real environment adds different start dates, commercial rates, commitment coverage and the specific services each change touches. Every euro of the result should still be explainable.
Azure prices do not all follow the same commercial mechanism
Another common mistake is treating Microsoft’s public retail price as the future invoiced cost.
Microsoft documents that Azure is priced in US dollars under the Microsoft Customer Agreement and the Microsoft Partner Agreement. The monthly cost is calculated in USD and converted to the billing currency at a rate fixed at the end of the previous month. Enterprise Agreements price Azure in local currency under their own terms.
The Azure Retail Prices API is very useful for comparing services, regions and SKUs. Microsoft is explicit that its non USD prices are for reference, to help estimate budgets, and that they will not match an invoice. CSP customers also have their own commercial conditions on top.
A 2027 budget you can defend separates at least three things:
- What Microsoft has officially announced
- What the organisation is contractually paying
- What is assumed for planning purposes
A future price nobody has published yet belongs in the third group, visibly, until someone can prove it.
From cost reporting to financial planning
Azure Cost Management already gives you historical analysis, forecasts and budget alerts. Those are good operational tools.
Annual planning asks other questions. What does a storage optimisation starting in March save this year? What does an application going live in September add? How much more budget do we need if prices move in January? Which investment line pays for each effect? And can we compare those alternatives before the budget is approved?
That is the problem we are working on in Governator, GenioCT’s cloud governance and financial intelligence platform.
The Governator annual Budget Planner
We have built and tested the first version of a scenario based annual Budget Planner in Governator. It is being released now, and we are validating it against real published invoices before anyone budgets with it.
The planner does not extrapolate last year. It builds versioned forecasts from published financial data, in four kinds of scenario:
| Scenario | Purpose |
|---|---|
| Business as usual | Next year without any planned intervention |
| Planned budget | New projects, infrastructure changes and selected optimisations |
| Pricing pressure | Exposure to hypothetical price and currency movements |
| Custom | Any other financial or technical decision you want to test |
Each forecast is broken down by month, investment line, service and financial component. It separates the existing run rate from each assumption that changes it, and shows the interaction between price and consumption on its own line.
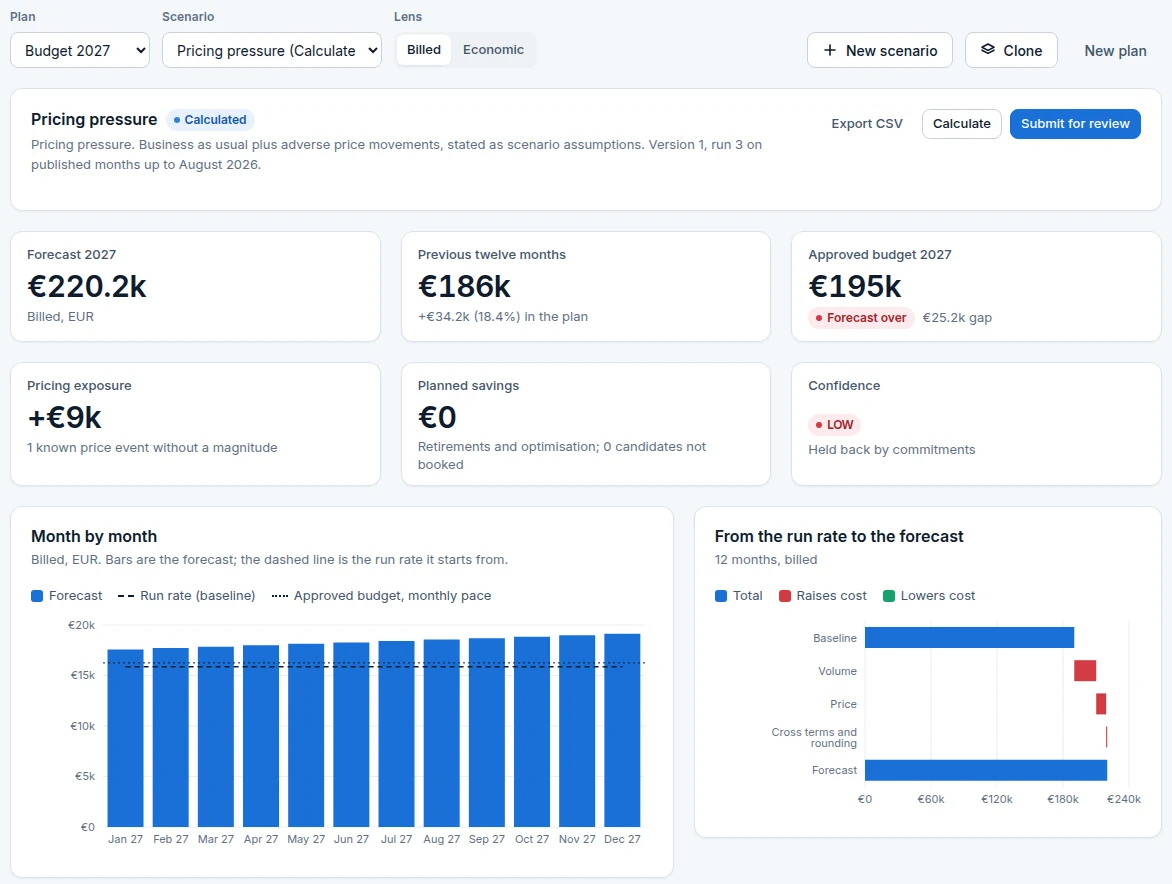
It also keeps billed and economic cost apart. A reservation paid upfront shows in the month it is invoiced in the billed view, and spread over its term in the economic view, and the two are never added together.
What happens with the 2027 price announcements?
Here the difference between evidence and assumption does the work, and the two 2027 events end up in different places.
Governator records the January 2027 local currency update without giving it a percentage. Until a figure is published or contractually confirmed, it shows as a known change with an unknown size. It changes no amount and lowers the forecast’s confidence.
The February regional increase goes into the assumption registry as published, with its source, the date it was checked, the region and the services it covers. Because the notice applies to some VM series and some Storage meters only, the planner asks for the share of each service that is in scope instead of applying 9% to everything, and it applies the change from February. Existing reservations are left untouched.
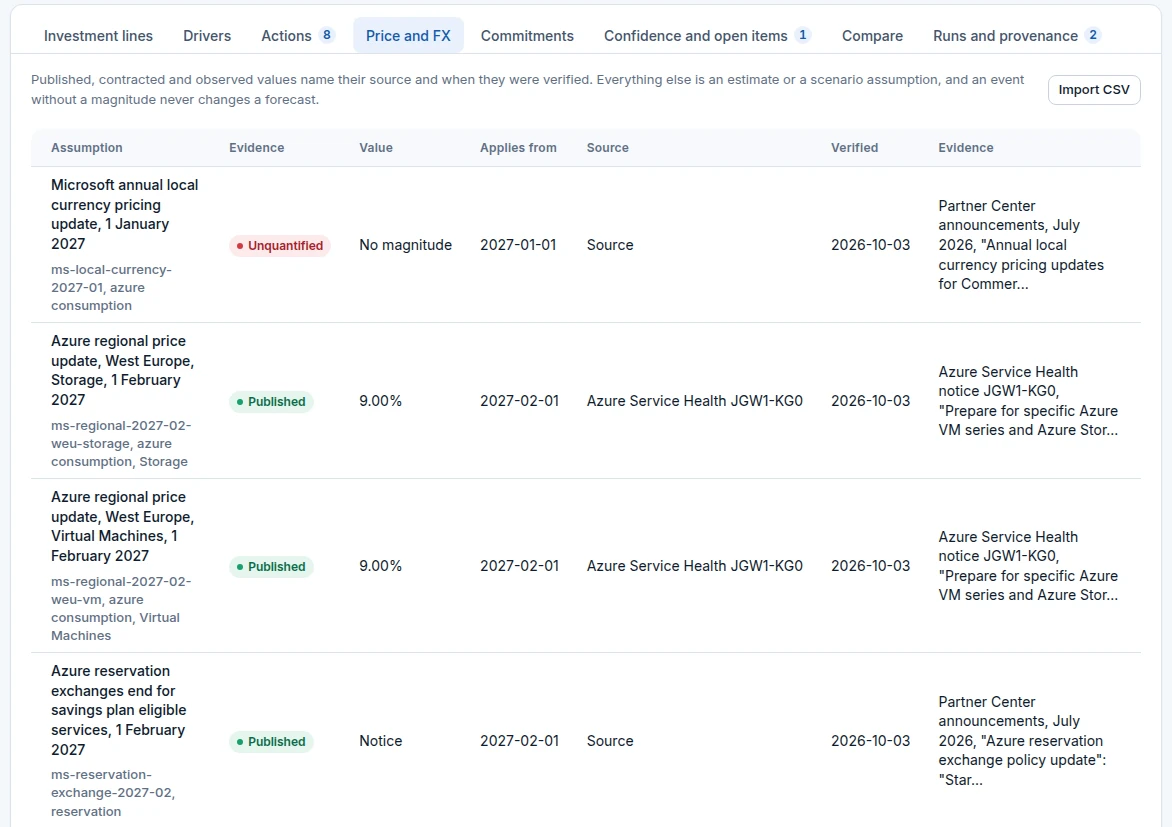
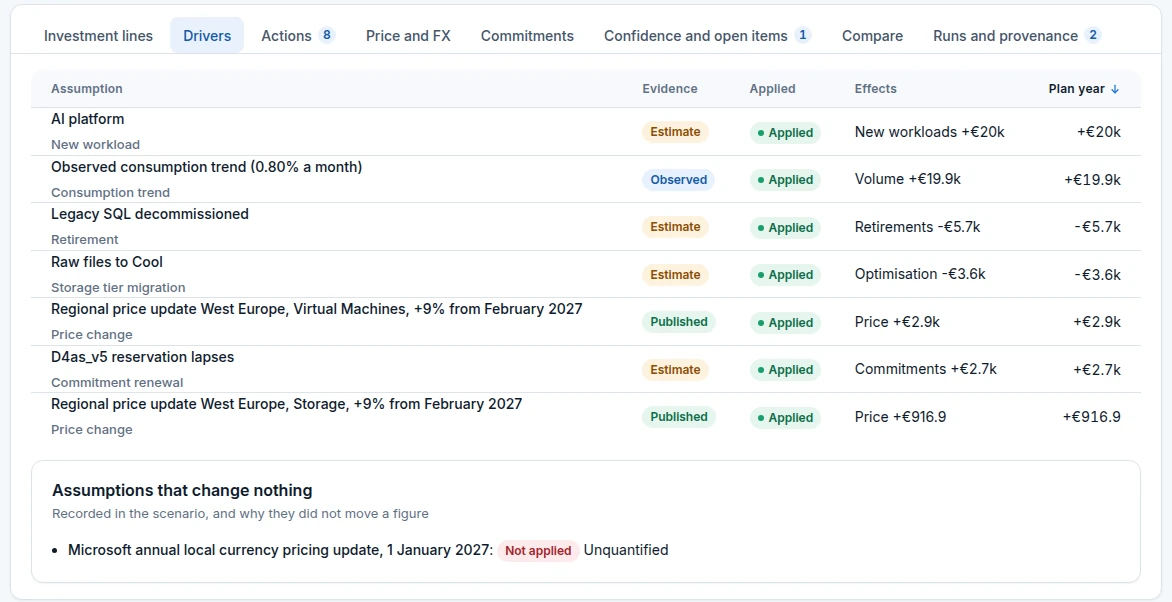
Meanwhile you can test your exposure with what if assumptions that say plainly what they are. Once verified prices are available, they enter the registry with their source and the date they were checked, and the scenarios that use them recalculate.
Next on our list is a Price Change Watch. When an assumption that an approved budget depends on changes, Governator will flag that budget for reassessment. An approved plan keeps its figures. The controller sees what the new assumption would do and decides whether a revision is needed.
A budget should explain itself
Producing an annual total is the easy part. Defending it is harder: when a financial controller asks why spend goes up, or an application owner questions the budget allocated to them.
A cloud budget you can defend traces each projected figure back to historical costs, commercial conditions and individual planning decisions, and says which numbers are still uncertain. This is most useful in larger Azure environments, where shared infrastructure, reservations, data platforms and several application portfolios all end up on the same monthly invoice.
Don’t wait until January to revisit your 2027 budget
Microsoft’s new pricing schedule is a useful reminder that cloud financial planning cannot rest on last year’s spend alone. If you are preparing a 2027 budget now, separate consumption growth from pricing exposure, review your commercial commitments and write down the assumptions that may need revisiting in November.
The question for 2027 is broader than what Azure cost this year. What will the current environment cost next year, what could change that figure, and which decisions can you take now to keep it under control?
That is where we are taking Governator: from reporting on historical cost to financial planning that can explain its own numbers.
Official Microsoft references
- July 2026 Partner Center announcements: annual local currency pricing updates for Commercial Cloud
- Microsoft Customer Agreement FAQ: how Azure is priced and converted
- Azure Retail Prices API
- Azure plan price list for CSP partners
- Azure Service Health notice JGW1-KG0, “Prepare for specific Azure VM series and Azure Storage service price updates in seven Azure regions globally”, sent to subscriptions using the affected services (no public page at the time of writing)
Cloudivence, formerly Governator
Cloudivence connects Azure cost, ownership and security findings on one evidence model, so every figure and every finding leads to its owner and its source. It runs in assisted pilots.
More from the blog
From Governator to Cloudivence: When an Internal Azure Tool Becomes a Product
Governator Has Grown Beyond Compliance, and the Data Model Is Why